 Run click the button to execute the code.
 Graph click the button to plot your results. Set the graph options as shown. Save the graph as NumHidden.emf.
Prediction |
| The prediction of the future is one of the most exciting human dreams. The prediction of future numeric values in a time series is a very common problem. ANNs are a great option to predict values when the model that produces the produces the series is unknown or when this model changes with time. |
| Tip |
| The proper use of ANN for prediction requires the adjustment of several parameters and procedures. Imagination and expertise are required to warranty the quality of the prediction values. |
ANN Prediction |
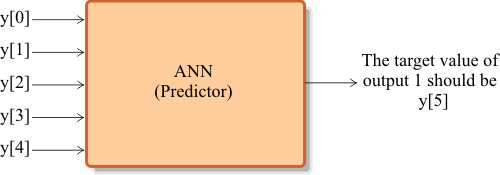
| To train an ANN for prediction, some of the values in the series are applied at the input of the network, while the target of the network is one future value in the same data series. For instance in the figure below the values of: y[0], y[1], y[2], y[3] and y[4], are used to predict the value of y[5]. |
| Tip |
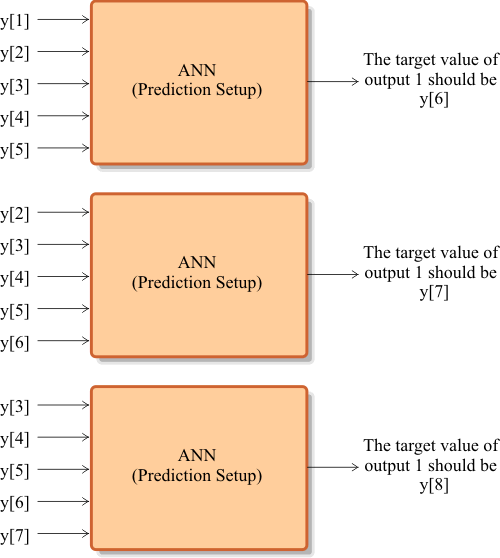
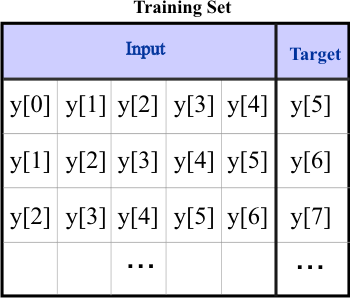
| The figure below shows how to build a training set for prediction. In the first case, the value of y[6] is predicted using the values of: y[1], y[2], y[3], y[4] and y[5]. In the second case, the value of y[7] is predicted using the values of: y[2], y[3], y[4], y[5] and y[6]. The remaining training cases are similarly built until all the values in the original series are used. |
Wrapped data set |
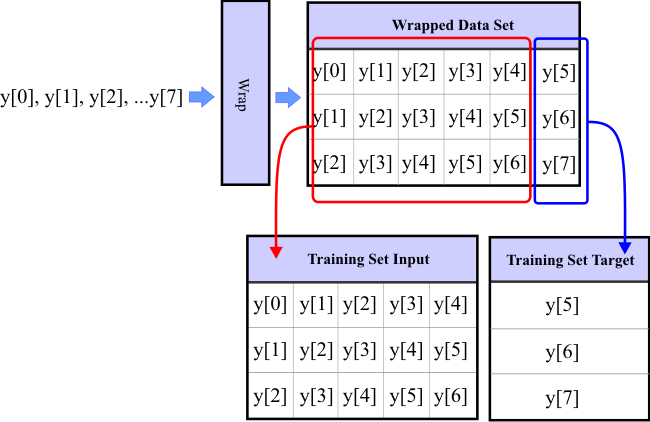
| A wrapped data set is produced when a data series is wrapped for prediction purposes. The original series is wrapped to generate a data set for prediction. This wrapped data set is, then, split to generate the training set input and the training set target as shown below. |
| Tip |
| To improve the accuracy of the prediction, many previous values in the series must be used to predict the future value(s). Consequently, the number of inputs in the ANN must be properly modified affecting the required number of training cases. Thus, the number of inputs in the network must be increased as much as possible without producing over-fitting. |
| Tip |
| When adjusting the number of inputs of the network or the number neurons in the hidden layer, never train the ANN with over-fitting. |
| Problem 1 |
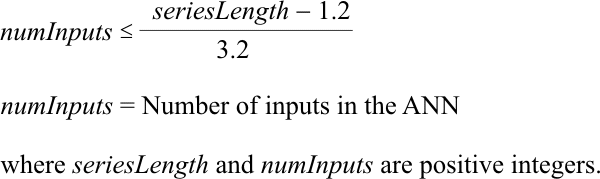
| An ANN is being used for prediction of one value in a data series. The network has one hidden layer. To avoid over-fitting, suppose that the minimum number of training cases is 2.2 times the number of weights in the hidden layer. Show that the number of neurons in the hidden layer is given by the expression below. |
| Problem 2 |
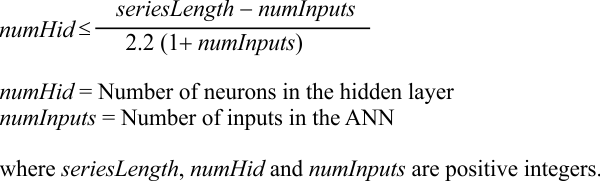
| A time series has a length of 100. An ANN used for prediction has one hidden layer. Suppose that the minimum number of training cases is 2.2 times the number of weights in the hidden layer. Compute manually the maximum number of neurons in the hidden layer of this network, you may use Microsoft Excel. Discuss your results focusing in how to select the optimum number of inputs of the network and the number of neurons in the hidden layer. |
Prediction Work Area |
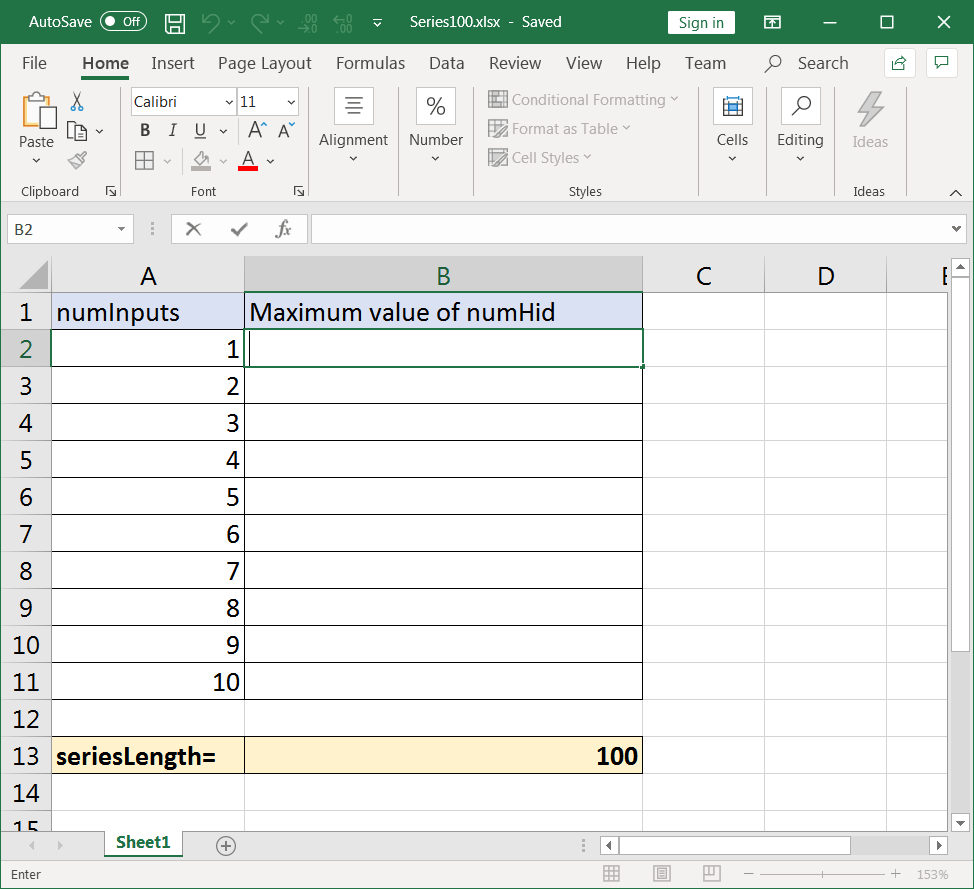
| To draw the prediction work area, it is necessary to plot the number of neurons in the hidden layer (numHid) as a function of the number of inputs in an ANN (numInputs). The prediction work area is described by all the points in this plot that will not produced over-fitting during the training of the ANN. |
| Problem 3 |
| Create a Neural Lab project called NumHidden to plot the number of neurons in the hidden layer (numHid) as a function of the number of inputs in the ANN (numInputs) for a series of length 100. Suppose that the minimum number of training cases is 2.2 times the number of weights in the hidden layer. Suppose also that the network has one hidden layer. |
| Solution 3 |
| After editing the file, Run click the button to execute the code.Graph click the button to plot your results. Set the graph options as shown. Save the graph as NumHidden.emf. |
| NumHidden\Main.lab |
| int seriesLength = 100; Vector numInputs; numInputs.CreateSeries(1, 10, 10); // 1, 2, 3, ... , 10 Vector numHid = floor( (seriesLength -numInputs)/(2.2*(1+numInputs))); |
| Problem 4 |
| In the graph of the last problem: (a) Which region is the prediction work area? (b) Which region is the over-fitting area? |
Prediction Analysis |
The mean squared error (mse) obtained during training is an indicator of the quality of the prediction and may change when the number of inputs in the ANN or the number of neurons in the hidden layer are modified. The quality of the prediction is, then, affected by the structure of the ANN. Prediction analysis is divided in two parts:
|
Mse Prediction Analysis |
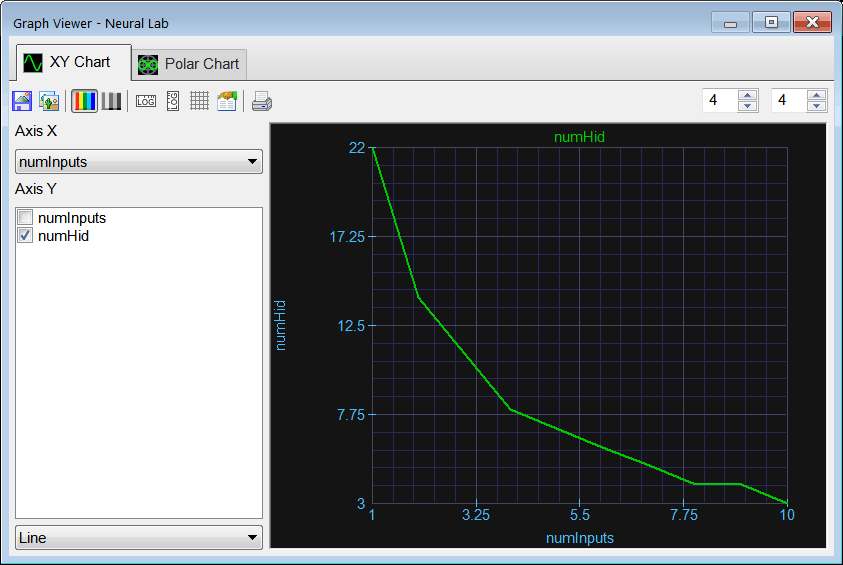
| In mse prediction analysis, the mse (during the training of an ANN) is computed for several values of the number of neurons in the hidden layer and the number of inputs of the network. The figure below shows a typical mse prediction analysis table. The red color values describe the over-fitting area, and these values should be ignored. The blue color values describe the prediction work area and represent the set of possible choices for numInputs and numHid. |
| Tip |
| In mse prediction analysis, we look for the best combination the produces the minimum value for the mse. However, there are several tendencies in the mse that need to be reviewed to make a choice. |
| Problem 5 |
| A student is performing a mse prediction analysis. There are two mse small values that are very similar. Both values are in the same row, however, one value is in the column with numHid = 4, and the other one is in the column with numHid = 5. What value should be chosen? |
| Problem 6 |
| A professor is performing a mse prediction analysis. He notices that there are two mse small values that are very similar. Both values are in the same column, however, one value is in the row with Num Inputs = 4, and the other one is the row with Num Inputs = 5. What value should be chosen? |
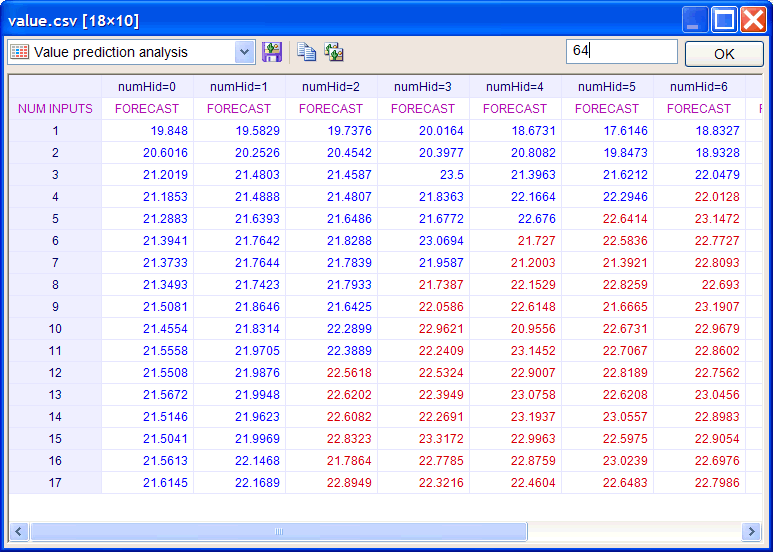
Value Prediction Analysis |
| In Value Prediction Analysis, the forecast (prediction) value is computed for several values of the number of neurons in the hidden layer and the number of inputs of the network. The figure below shows a typical value prediction analysis table. The red color values represent the forecast that were computer with over-fitting and they should be ignored. The blue color values represent the set of possible choices for the number of inputs and the number of neurons in the hidden layer. In some cases, mse prediction analysis does not provide one clear option but a set of choices. In these cases, value prediction analysis provides additionally information and measure the impact in the forecast for each option in the set of choices. |
| Problem 7 |
| An ANN is being used for prediction of one value in a data series. The network has zero hidden layers. To avoid over-fitting, suppose that the minimum number of training cases is 2.2 times the number of weights in the network. Show that the number of inputs in the ANN is given by the expression below. |
| Tip |
| If the mse never becomes acceptable after varying the number of inputs in the network and the number of neurons in the hidden layer, it means that it is not possible to predict a future value in the series. |